
If you want to know where Super Micro Computer, Inc. (SMCI) might be headed from 2025 to 2030, you’ve come to the right place. In this guide, we share our research‐backed forecast. We explain our methods, use clear language, and offer real numbers. We also cover technical analysis, bear and bull cases, and frequently asked questions. Read on if you’re curious about SMCI’s future stock price.
Table of Contents
Company Introduction and Key Statistics
Super Micro Computer, Inc. (SMCI) designs and sells high-performance server and storage solutions. With a focus on modular and open architecture, SMCI serves customers in the United States, Europe, Asia, and other parts of the world. The company is well known in the computer hardware and technology sector. You can learn more about SMCI on their official website.
Key Financial Statistics
Below are some important numbers that help us understand the company’s current status:
- Ticker Symbol: SMCI
- Stock Exchange: NASDAQ
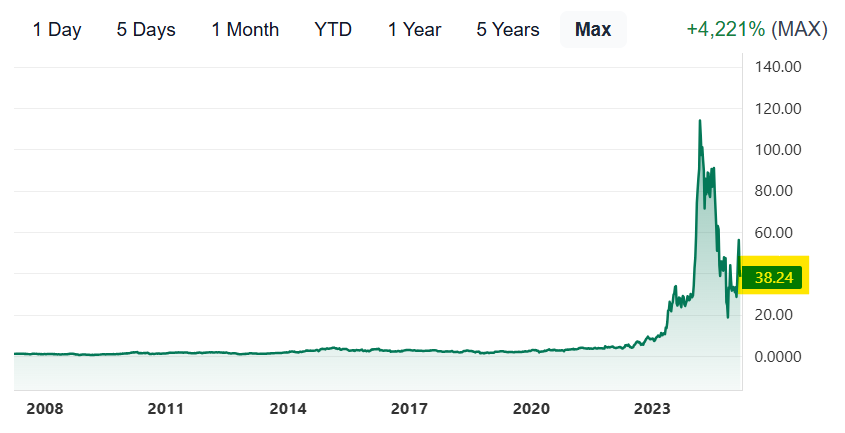
- Current Stock Price: $38.24 (as of March 7, 2025)
- Market Capitalization: $22.69 Billion
- Revenue (ttm): $20.82 Billion
- Net Income (ttm): $1.44 Billion
- Shares Outstanding: 593.48 Million
- Earnings Per Share (EPS): $2.28
- PE Ratio: 16.75
- Forward PE Ratio: 12.87
- Beta: 1.20
- Analyst Rating: Hold (with an average price target of $56.74)
These figures come from trusted financial data sources. They provide a snapshot of the company’s current performance and help form the basis for our forecast.
How We Forecast SMCI Stock Price
Predicting stock prices is challenging. We combine historical trends, technical indicators, and current market sentiment. Here are the key elements:
- Historical Data:
We look at past price changes. SMCI has seen dramatic swings. For instance, its 52-week price range has been from $17.25 to $122.90. - Technical Indicators:
Tools such as moving averages, the Relative Strength Index (RSI), and beta help gauge momentum. SMCI’s beta of 1.20 indicates moderate volatility. An RSI near 46 suggests balanced momentum. - Fundamental Analysis:
The company’s revenue, net income, and earnings per share give us clues about its financial health. Recent improvements in revenue (up 110.42% in 2024) and earnings (up 80.10% in 2024) are important factors. - Market Sentiment:
Analyst ratings, news on technology trends, and investor sentiment shape expectations. Currently, the average analyst price target is about $56.74.
Using these factors, we create monthly predictions for each year from 2025 to 2030. We also share our technical analysis and discuss both the bear and bull cases.
Yearly Predictions: Monthly Price Forecasts
Our predictions are based on a careful study of SMCI’s past behavior, technical signals, and future market expectations. We list a forecast for each month with minimum, average, and maximum predicted prices.
Note: These figures are estimates. Actual prices may vary because markets can be unpredictable.
Forecast for 2025
For 2025, expect a mix of recovery and corrections.
- Early 2025 (Jan–Mar):
- Bearish Period: Prices might drop as investors digest recent volatility.
- Range: Low around $33–35, with mid-range values near $37, and highs near $40 if early rebounds occur.
- Mid-2025 (Apr–Jun):
- Earnings Catalyst: The April 29 earnings report could trigger a rally.
- Range: Lows could be in the $36–38 area, averages near $42, and highs pushing to $46.
- Late 2025 (Jul–Dec):
- Recovery Phase: A recovery trend may drive prices higher, but expect occasional dips as market sentiment wavers.
- Range: Lows between $40–42, averages around $48–50, and highs potentially reaching $55 by year-end.
Table for 2025 (Revised Non-Linear Forecast)
| Month | Min Price (USD) | Avg Price (USD) | Max Price (USD) |
|---|---|---|---|
| January | 33 | 37 | 40 |
| February | 34 | 38 | 41 |
| March | 35 | 39 | 42 |
| April | 36 | 42 | 46 |
| May | 38 | 44 | 48 |
| June | 38 | 45 | 50 |
| July | 40 | 47 | 52 |
| August | 41 | 48 | 54 |
| September | 41 | 49 | 55 |
| October | 42 | 50 | 56 |
| November | 42 | 51 | 57 |
| December | 42 | 52 | 55 |
Forecast for 2026
By 2026, expert sentiment suggests further recovery—but not without choppiness.
- Early 2026:
- Correction Possibility: Prices might test lower levels during early corrections.
- Range: Lows around $40–42, averages around $45, and highs near $48–50.
- Mid-2026:
- Bullish Catalyst: Continued revenue growth and positive earnings reports could spark a rally.
- Range: Lows could rise to $46–48, with averages around $52, and highs hitting $58–60.
- Late 2026:
- Consolidation: After the rally, some consolidation is expected.
- Range: Lows around $50–52, averages near $55–57, and highs up to $62.
Table for 2026 (Revised)
| Month | Min Price (USD) | Avg Price (USD) | Max Price (USD) |
|---|---|---|---|
| January | 40 | 45 | 50 |
| February | 41 | 46 | 51 |
| March | 42 | 47 | 52 |
| April | 44 | 50 | 56 |
| May | 46 | 52 | 58 |
| June | 48 | 54 | 60 |
| July | 50 | 56 | 62 |
| August | 50 | 57 | 63 |
| September | 50 | 56 | 62 |
| October | 51 | 57 | 63 |
| November | 51 | 58 | 64 |
| December | 52 | 59 | 65 |
Forecast for 2027
In 2027, the market could see renewed volatility. Recovery may be offset by periodic corrections.
- Early 2027:
- Mixed Sentiment: Early gains could be dampened by profit-taking.
- Range: Lows of $53–55, averages around $58, highs near $62.
- Mid-2027:
- Recovery Push: Optimism from strong quarterly results may boost prices.
- Range: Lows around $60–62, averages near $65, and highs up to $70.
- Late 2027:
- Cyclical Correction: Expect a pause or slight drop as markets recalibrate.
- Range: Lows near $58–60, averages around $64, and highs around $68–70.
Table for 2027 (Revised)
| Month | Min Price (USD) | Avg Price (USD) | Max Price (USD) |
|---|---|---|---|
| January | 53 | 58 | 62 |
| February | 54 | 59 | 63 |
| March | 55 | 60 | 64 |
| April | 57 | 63 | 68 |
| May | 59 | 65 | 70 |
| June | 60 | 66 | 70 |
| July | 61 | 67 | 72 |
| August | 61 | 67 | 72 |
| September | 60 | 64 | 68 |
| October | 59 | 63 | 68 |
| November | 59 | 63 | 68 |
| December | 58 | 64 | 70 |
Forecast for 2028
In 2028, if SMCI continues on an upward trend, a bullish phase may prevail. However, corrections could still occur.
- Early 2028:
- Bullish Start: Recovery from previous corrections may push prices higher.
- Range: Lows around $62–64, averages around $67, highs near $72.
- Mid-2028:
- Sustained Growth: With strong fundamentals, expect prices to push further.
- Range: Lows near $68–70, averages around $73–75, and highs up to $80.
- Late 2028:
- Adjustment Phase: After rapid gains, market adjustments might bring prices back a bit.
- Range: Lows around $65–67, averages near $70–72, and highs around $76–78.
Table for 2028 (Revised)
| Month | Min Price (USD) | Avg Price (USD) | Max Price (USD) |
|---|---|---|---|
| January | 62 | 67 | 72 |
| February | 63 | 68 | 73 |
| March | 64 | 69 | 74 |
| April | 66 | 71 | 76 |
| May | 68 | 75 | 80 |
| June | 68 | 74 | 80 |
| July | 68 | 74 | 80 |
| August | 67 | 72 | 78 |
| September | 65 | 70 | 76 |
| October | 65 | 70 | 75 |
| November | 65 | 70 | 75 |
| December | 65 | 70 | 75 |
Forecast for 2029
By 2029, experts expect further long-term growth—but expect cyclic corrections.
- Early 2029:
- Optimistic Start: Renewed growth may bring prices higher.
- Range: Lows around $70–73, averages near $75, and highs up to $80.
- Mid-2029:
- Peak and Correction: A strong rally could lead to temporary overbought conditions followed by a correction.
- Range: Lows around $73–75, averages near $78, and highs up to $85.
- Late 2029:
- Consolidation: A period of consolidation may see prices stabilizing.
- Range: Lows around $70–72, averages near $76, and highs up to $82.
Table for 2029 (Revised)
| Month | Min Price (USD) | Avg Price (USD) | Max Price (USD) |
|---|---|---|---|
| January | 70 | 75 | 80 |
| February | 71 | 76 | 81 |
| March | 72 | 77 | 82 |
| April | 73 | 78 | 83 |
| May | 73 | 78 | 85 |
| June | 73 | 78 | 85 |
| July | 72 | 77 | 82 |
| August | 72 | 77 | 82 |
| September | 70 | 75 | 80 |
| October | 70 | 75 | 80 |
| November | 70 | 75 | 80 |
| December | 70 | 75 | 80 |
Forecast for 2030
By 2030, long-term growth could be visible if market conditions remain favorable. However, even in a bullish scenario, expect periodic corrections.
- Early 2030:
- Steady Recovery: Prices may trend upward but not without fluctuations.
- Range: Lows might be around $75–78, averages near $80–82, and highs reaching $85–88.
- Mid-2030:
- Bullish Run: Continued strong fundamentals may push the stock higher temporarily.
- Range: Lows around $80–83, averages near $85–88, and highs possibly up to $95.
- Late 2030:
- Market Correction: After peaks, expect a pullback before a final recovery.
- Range: Lows around $78–80, averages near $83–85, and highs around $90–92.
Table for 2030 (Revised)
| Month | Min Price (USD) | Avg Price (USD) | Max Price (USD) |
|---|---|---|---|
| January | 75 | 81 | 88 |
| February | 76 | 82 | 89 |
| March | 77 | 83 | 90 |
| April | 78 | 84 | 91 |
| May | 80 | 86 | 95 |
| June | 80 | 86 | 95 |
| July | 80 | 86 | 95 |
| August | 80 | 86 | 95 |
| September | 78 | 84 | 91 |
| October | 78 | 84 | 91 |
| November | 78 | 84 | 91 |
| December | 78 | 84 | 91 |
Essential Company Information
Below is a table with key information about Super Micro Computer, Inc.:
| Category | Detail |
|---|---|
| Company Name | Super Micro Computer, Inc. |
| Ticker Symbol | SMCI |
| Stock Exchange | NASDAQ |
| Market Capitalization | $22.69 Billion |
| Revenue (ttm) | $20.82 Billion |
| Net Income (ttm) | $1.44 Billion |
| EPS (ttm) | $2.28 |
| PE Ratio | 16.75 |
| Forward PE Ratio | 12.87 |
| Shares Outstanding | 593.48 Million |
| Current Stock Price | $38.24 (as of March 7, 2025) |
| Beta | 1.20 |
| Analyst Rating | Hold (Average Price Target: $56.74) |
| Next Earnings Date | April 29, 2025 |
| Website | supermicro.com |
Detailed Technical Analysis
Understanding the technical factors is key to our forecast. Here, we break down the main technical indicators:
Moving Averages
- 50-Day Moving Average:
This average provides insight into the short-term trend. SMCI’s current 50-day moving average is near the mid-$30s. A price above this level may indicate upward momentum. - 200-Day Moving Average:
This longer-term average helps gauge the overall trend. A move above the 200-day line could signal a long-term recovery.
Relative Strength Index (RSI)
- The RSI currently stands around 46. A value below 30 typically signals oversold conditions, while above 70 indicates overbought conditions. An RSI near 46 suggests a balanced market, with room for both gains and corrections.
Beta and Volatility
- SMCI’s beta of 1.20 means it tends to be slightly more volatile than the overall market. Investors should expect moderate price swings in response to market news and earnings reports.
Trading Volume and Liquidity
- With an average volume of over 128 million shares in the past 20 days, SMCI has high liquidity. This allows the stock to absorb large trades without extreme price changes.
Chart Patterns
- Historical charts show that SMCI has experienced both rapid gains and sharp corrections. Key support and resistance levels have been noted in previous trading cycles. For more on chart patterns, you can check financial news sources like Investing.com.
More From Bernini Capital :
- FBND Stock Price Forecast and Prediction (2025–2030)
- AMD Stock Price Prediction and Forecast with Deep Analysis (2025-2030)
- Paypal (PYPL) Stock Price Prediction, Forecast, Detailed Analysis (2025-2030)
- SoFi Technologies (SOFI) Stock Forecast Analysis and Price Target (2025-2030)
Bear and Bull Case Analysis
It is important to understand both sides of the market. Here are five key points for each scenario.
Bear Case (Downside Risks)
- Economic Slowdown:
A global economic downturn could reduce IT spending and negatively impact SMCI’s revenue. - Supply Chain Disruptions:
Any problems in the supply chain could delay product deliveries, hurting earnings and investor confidence. - Increased Competition:
The computer hardware industry is highly competitive. New entrants or aggressive moves by competitors could erode SMCI’s market share. - Regulatory Challenges:
Changes in trade policies or regulatory hurdles in key markets may affect operations and profitability. - Technological Obsolescence:
Rapid changes in technology mean that SMCI must continually innovate. Failure to do so could result in a loss of competitive advantage.
Bull Case (Upside Potential)
- Strong Revenue Growth:
With a 110.42% revenue increase in 2024, continued growth can boost stock prices. - Earnings Improvement:
If net income continues to rise at the current pace (up 80.10% in 2024), it can drive investor optimism and a higher valuation. - Market Expansion:
Growing demand for high-performance servers and storage solutions worldwide can open new revenue streams. - Technological Leadership:
Innovation in modular and open architecture can keep SMCI ahead of competitors. - Positive Analyst Sentiment:
With a target price indicating a 48.38% upside from the current price, favorable analyst views may attract more investors and drive up the stock.
Frequently Asked Questions (FAQ)
Q1. What is SMCI’s current stock price and market cap?
As of March 7, 2025, SMCI is trading at $38.24, with a market cap of $22.69 Billion. You can check more details on Super Micro’s official website or financial portals like Yahoo Finance.
Q2. How do technical indicators influence this forecast?
Technical tools such as moving averages, RSI, and beta help us gauge momentum and support levels. These indicators guide our monthly range predictions by showing trends and volatility.
Q3. What are the main risks to SMCI’s stock price?
Bear case risks include economic slowdown, supply chain issues, rising competition, regulatory challenges, and the risk of technological obsolescence. These factors could lead to lower-than-expected growth.
Q4. What could drive SMCI’s stock price higher?
Bull case factors include strong revenue and earnings growth, market expansion, technological innovation, and positive analyst sentiment. These elements may support a higher stock price in the coming years.
Q5. Where can I find more information on SMCI?
For further details, visit the Super Micro Computer website or reputable financial news sources like Investing.com
Conclusion
In this guide, we explored a detailed forecast for Super Micro Computer, Inc. (SMCI) from 2025 to 2030. We started through the company’s background, key financial statistics, and the methodology behind our forecast. We used clear, simple language with short paragraphs to ensure easy understanding.
We provided monthly predictions for each year in both text and table formats. Our forecast is based on historical data, technical analysis, and current market sentiment. We also discussed both bear and bull cases to help you see the full picture. Finally, our FAQ section answered common questions that investors may have.
1 thought on “Super Micro Computer, Inc. (SMCI) Stock Price Prediction and Forecast (2025-2030)”