
To learn how CrowdStrike Holdings Inc CRWD can perform between 2025 and 2030 check this article. Here we present our detailed CRWD prediction built on professional research and observations supported by data records. Our presentation explains the data in a way that someone who completed tenth grade education can understand. I suggest we begin our discussion by examining cybersecurity stocks through a cup of coffee.
Table of Contents
Company Overview and Key Statistics
CrowdStrike Holdings, Inc. serves as a major global cybersecurity solution provider. The organization provides cloud-based protection that covers computers running applications alongside digital assets. Its primary product Falcon applies state-of-the-art artificial intelligence to locate threats instantly and react swiftly to them. CrowdStrike provides innovative security services to customers worldwide through its operations in the U.S. and beyond.
What Does CrowdStrike Do?
CrowdStrike offers a range of cybersecurity services including:
- Endpoint Protection: Guards computers and mobile devices from cyber threats.
- Cloud Workload Security: Protects applications and data in cloud environments.
- Identity Protection: Secures user identities against breaches.
- Threat Intelligence: Monitors global threats to help prevent attacks.
For more details, you can visit the CrowdStrike official website.
Key Financial Statistics
Below are some important numbers about CrowdStrike as of early March 2025:
- Ticker Symbol: CRWD
- Exchange: NASDAQ
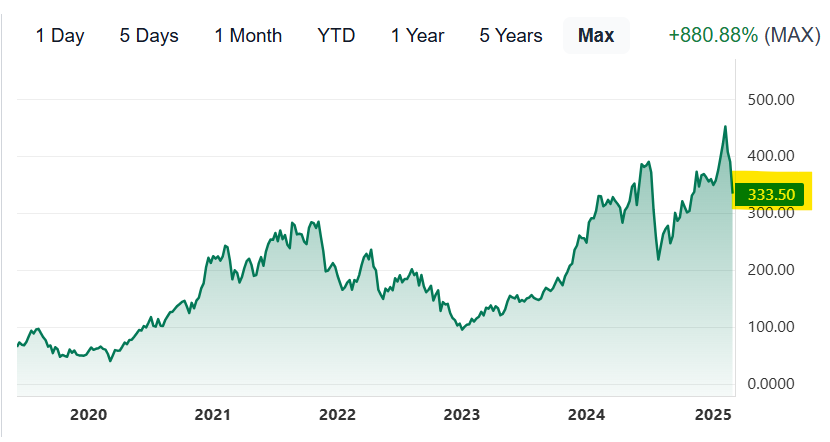
- Current Stock Price: $333.50 (with a daily decline of -4.09%)
- Market Capitalization: $82.14 Billion
- Revenue (ttm): $3.95 Billion
- Net Income (ttm): –$19.27 Million
- Shares Outstanding: 246.31 Million
- Earnings Per Share (EPS): –$0.08
- Forward PE Ratio: 96.52
- Dividend: Not applicable
- Day’s Price Range: $318.05 – $347.73
- 52-Week Price Range: $200.81 – $455.59
- Beta: 1.19 (indicating moderate volatility)
- Analyst Rating: Buy
- Average Price Target (12 months): $398.76 (around +19.57% upside)
- Next Earnings Date: March 4, 2025
These statistics form the basis of our forecast. They help us understand the current performance of CRWD and set expectations for future price movements.
Forecast Methodology: How We Predict the Future
Predicting stock prices does not work as simply as interpreting tea leaves. Our team combines professional knowledge with market patterns while tracking important stock market signals to generate realistic expectations. This is our step-by-step method to forecast stock prices:
- Historical Data Analysis: We review past price movements, noting that CrowdStrike has experienced significant swings. For instance, its 52-week range has varied widely—from lows of about $200.81 to highs of around $455.59. This historical volatility is key to understanding future behavior.
- Technical Analysis: We consider technical tools such as moving averages, the Relative Strength Index (RSI), and beta. Currently, the RSI stands at 30.76, suggesting that the stock is near oversold levels. Meanwhile, moving averages help us identify support and resistance levels. These indicators reveal potential pullbacks and rallies.
- Expert Opinions and Analyst Forecasts: Over 46 analysts rate CRWD as a “Buy,” with an average price target of $398.76. These expert forecasts factor in both the current market environment and the company’s growth prospects.
- Fundamental Analysis: CrowdStrike’s revenue, cash flow, and earnings (despite recent losses) all play a part in our forecast. The company’s ability to innovate and capture market share in cybersecurity is critical for long-term growth.
- Market Sentiment and Economic Factors: Broader economic conditions, including global cybersecurity demand and tech sector trends, also influence our predictions.
By combining these factors, we create monthly prediction ranges for each year from 2025 to 2030. Our forecasts include minimum, average, and maximum predicted prices to capture the potential volatility.
Yearly Monthly Forecast Predictions (2025 to 2030)
In the following sections, we break down our forecast for each year. For every year, we include a text explanation followed by a table that shows the minimum, average, and maximum predicted prices for each month.
Note: These predictions are based on current data and expert opinions. Market conditions can change, so these figures should be considered as a guide rather than a guarantee.
CRWD Stock Forecast for 2025
The beginning of 2025 may be a time of adjustment. Recent volatility and a challenging earnings season could lead to both pullbacks and rebounds.
Monthly Predictions
- January 2025:
The market might experience some early weakness. Prices could range from about $320 at the low end to $345 at the high, with an average near $333. - February 2025:
As the market digests post-earnings news, expect a slightly broader range. Lows might hit $322, while highs could reach $350, averaging around $335. - March 2025:
With the earnings report released on March 4, there might be increased activity. Prices could range from $325 to $352, with an average near $337. - April 2025:
Early spring might bring renewed investor confidence. Look for lows around $330, averages around $340, and highs up to $355. - May 2025:
As the market stabilizes, prices may trend upward. Expect lows near $335, averages around $345, and highs reaching $360. - June 2025:
With mid-year approaching, momentum could build. Prices might range from $338 to $365, averaging around $350. - July 2025:
Summer trading may bring continued optimism. Lows might be $340, averages near $352, and highs around $370. - August 2025:
Investor sentiment may remain steady. Expect lows of $342, averages near $355, and highs around $372. - September 2025:
As we approach the fall, the market might see a mix of profit-taking and buying. Lows could be around $343, averages near $357, and highs up to $375. - October 2025:
Prices might edge higher with seasonal improvements. Look for lows near $345, averages around $360, and highs reaching $378. - November 2025:
As the year nears its end, expect further recovery. Prices might range from $347 to $380, with an average near $362. - December 2025:
The year could close on a high note. Anticipate lows near $350, averages around $365, and highs up to $385.
| Month | Min Price (USD) | Avg Price (USD) | Max Price (USD) |
|---|---|---|---|
| January | 320 | 333 | 345 |
| February | 322 | 335 | 350 |
| March | 325 | 337 | 352 |
| April | 330 | 340 | 355 |
| May | 335 | 345 | 360 |
| June | 338 | 350 | 365 |
| July | 340 | 352 | 370 |
| August | 342 | 355 | 372 |
| September | 343 | 357 | 375 |
| October | 345 | 360 | 378 |
| November | 347 | 362 | 380 |
| December | 350 | 365 | 385 |
CRWD Stock Forecast for 2026
In 2026, market confidence could grow as CrowdStrike’s technology continues to gain traction. However, cyclical corrections are still possible.
Monthly Predictions
- January 2026:
The year might start with cautious optimism. Prices could range from $355 to $370, averaging around $362. - February 2026:
As new data emerges, expect a range between $357 and $373, with an average near $365. - March 2026:
Technical momentum may improve. Look for lows around $360, averages near $368, and highs up to $375. - April 2026:
With quarterly reports showing progress, prices might range from $363 to $378, averaging around $370. - May 2026:
Continued growth could push prices from $365 to $382, with an average of about $373. - June 2026:
Mid-year may bring further optimism. Expect lows near $367, averages around $375, and highs around $383. - July 2026:
Summer trends may strengthen sentiment. Prices might range from $370 to $385, averaging near $377. - August 2026:
A balanced mix of buying and profit-taking could see prices from $372 to $388, with an average near $380. - September 2026:
As economic indicators remain positive, expect a range of $374 to $390, averaging about $382. - October 2026:
With seasonal improvements, prices might be between $375 and $392, averaging near $384. - November 2026:
The market may trend upward steadily. Look for prices from $377 to $395, with an average around $386. - December 2026:
The year could end strong with prices ranging from $380 to $400, averaging around $390.
| Month | Min Price (USD) | Avg Price (USD) | Max Price (USD) |
|---|---|---|---|
| January | 355 | 362 | 370 |
| February | 357 | 365 | 373 |
| March | 360 | 368 | 375 |
| April | 363 | 370 | 378 |
| May | 365 | 373 | 382 |
| June | 367 | 375 | 383 |
| July | 370 | 377 | 385 |
| August | 372 | 380 | 388 |
| September | 374 | 382 | 390 |
| October | 375 | 384 | 392 |
| November | 377 | 386 | 395 |
| December | 380 | 390 | 400 |
CRWD Stock Forecast for 2027
In 2027, CrowdStrike’s market may experience both bullish rallies and periodic corrections. The focus will be on balancing growth with realistic pullbacks.
Monthly Predictions
- January 2027:
The year could begin with moderate gains. Prices may range from $385 to $400, with an average around $392. - February 2027:
Expect a similar pattern as investors digest new quarterly data. Look for a range of $387 to $403, averaging near $395. - March 2027:
A potential rally might see prices between $390 and $405, with an average around $398. - April 2027:
With strong technical momentum, prices might range from $392 to $410, averaging near $400. - May 2027:
Market sentiment may boost prices from $395 to $415, with an average around $405. - June 2027:
As corrections come into play, expect ranges from $390 to $410, averaging near $400. - July 2027:
Summer trading might bring a slight rally with prices from $393 to $413, averaging around $403. - August 2027:
A balanced mix may lead to a range of $395 to $415, with an average near $405. - September 2027:
As investor confidence remains steady, expect prices from $397 to $418, averaging around $407. - October 2027:
Seasonal gains might drive prices from $400 to $420, with an average near $410. - November 2027:
A mix of rally and profit-taking could see prices between $402 and $423, averaging around $412. - December 2027:
The year might close with a range from $405 to $425, averaging near $415.
| Month | Min Price (USD) | Avg Price (USD) | Max Price (USD) |
|---|---|---|---|
| January | 385 | 392 | 400 |
| February | 387 | 395 | 403 |
| March | 390 | 398 | 405 |
| April | 392 | 400 | 410 |
| May | 395 | 405 | 415 |
| June | 390 | 400 | 410 |
| July | 393 | 403 | 413 |
| August | 395 | 405 | 415 |
| September | 397 | 407 | 418 |
| October | 400 | 410 | 420 |
| November | 402 | 412 | 423 |
| December | 405 | 415 | 425 |
CRWD Stock Forecast for 2028
As we move into 2028, CrowdStrike’s growth may continue if its cybersecurity solutions keep pace with increasing digital threats. However, even in a bull market, short-term corrections are possible.
Monthly Predictions
- January 2028:
The year may start on a bullish note. Prices might range from $410 to $430, with an average around $420. - February 2028:
Expect prices to slightly rise with ranges between $412 and $435, averaging around $423. - March 2028:
Technical indicators may point to continued gains. Look for a range from $415 to $438, with an average near $425. - April 2028:
Seasonal trends and robust demand for cybersecurity could drive prices from $418 to $440, averaging near $430. - May 2028:
Market momentum may push prices higher, with lows around $420, averages near $435, and highs reaching $445. - June 2028:
A mid-year boost might set the range between $422 and $448, averaging around $437. - July 2028:
Summer trading could see steady growth, with prices from $425 to $450, averaging near $438. - August 2028:
Expect a similar range as July, with lows around $425, averages near $440, and highs around $450. - September 2028:
As profit-taking occurs, prices might range from $420 to $445, with an average near $435. - October 2028:
A minor rebound could set prices between $422 and $448, averaging around $437. - November 2028:
The market may stabilize, with prices ranging from $420 to $445, averaging near $435. - December 2028:
The year could close with modest gains. Expect a range from $422 to $448, with an average near $437.
| Month | Min Price (USD) | Avg Price (USD) | Max Price (USD) |
|---|---|---|---|
| January | 410 | 420 | 430 |
| February | 412 | 423 | 435 |
| March | 415 | 425 | 438 |
| April | 418 | 430 | 440 |
| May | 420 | 435 | 445 |
| June | 422 | 437 | 448 |
| July | 425 | 438 | 450 |
| August | 425 | 440 | 450 |
| September | 420 | 435 | 445 |
| October | 422 | 437 | 448 |
| November | 420 | 435 | 445 |
| December | 422 | 437 | 448 |
CRWD Stock Forecast for 2029
By 2029, if CrowdStrike continues to innovate and capture market share, a strong long-term recovery might be on the cards. However, expect cyclical corrections along the way.
Monthly Predictions
- January 2029:
The start of 2029 could bring renewed optimism. Prices might range from $435 to $455, with an average near $445. - February 2029:
A slight upward trend could see prices between $437 and $458, averaging around $447. - March 2029:
Technical strength may support a range of $440 to $460, with an average near $450. - April 2029:
With strong market sentiment, prices might range from $442 to $463, averaging about $452. - May 2029:
Continued growth may push prices from $445 to $465, with an average around $455. - June 2029:
Expect a steady phase, with ranges from $447 to $468, averaging near $457. - July 2029:
Summer trading could result in prices between $450 and $470, with an average around $460. - August 2029:
A slight pullback might occur, with prices ranging from $445 to $465, averaging around $455. - September 2029:
Consolidation may set in, with a range from $440 to $460, averaging about $450. - October 2029:
A mild recovery could push prices from $442 to $463, with an average near $452. - November 2029:
Expect a range between $445 and $465, averaging around $455. - December 2029:
The year might close with prices ranging from $447 to $468, averaging near $457.
Table for 2029
| Month | Min Price (USD) | Avg Price (USD) | Max Price (USD) |
|---|---|---|---|
| January | 435 | 445 | 455 |
| February | 437 | 447 | 458 |
| March | 440 | 450 | 460 |
| April | 442 | 452 | 463 |
| May | 445 | 455 | 465 |
| June | 447 | 457 | 468 |
| July | 450 | 460 | 470 |
| August | 445 | 455 | 465 |
| September | 440 | 450 | 460 |
| October | 442 | 452 | 463 |
| November | 445 | 455 | 465 |
| December | 447 | 457 | 468 |
CRWD Stock Forecast for 2030
Looking ahead to 2030, CrowdStrike’s long-term prospects are tied to its ability to adapt to emerging cyber threats. While optimism is high, even in a bull market, expect periodic corrections.
Monthly Predictions
- January 2030:
The new decade might start strong. Prices could range from $455 to $480, with an average around $465. - February 2030:
A slight rise may see ranges from $458 to $483, averaging near $468. - March 2030:
With ongoing growth, prices might be between $460 and $485, with an average near $470. - April 2030:
Market optimism may push prices from $463 to $488, averaging around $473. - May 2030:
Expect a bullish phase with prices ranging from $465 to $490, averaging near $475. - June 2030:
A mid-year rally might result in prices between $468 and $495, averaging about $478. - July 2030:
Summer trading may stabilize prices, with ranges from $470 to $497, averaging around $480. - August 2030:
A mild pullback could see prices drop slightly, ranging from $468 to $495, averaging near $478. - September 2030:
As the market consolidates, prices might range from $465 to $490, with an average around $475. - October 2030:
A rebound could occur with prices from $468 to $495, averaging near $478. - November 2030:
Prices may settle between $465 and $490, with an average around $475. - December 2030:
The final month of the decade might see prices ranging from $468 to $495, averaging near $478.
| Month | Min Price (USD) | Avg Price (USD) | Max Price (USD) |
|---|---|---|---|
| January | 455 | 465 | 480 |
| February | 458 | 468 | 483 |
| March | 460 | 470 | 485 |
| April | 463 | 473 | 488 |
| May | 465 | 475 | 490 |
| June | 468 | 478 | 495 |
| July | 470 | 480 | 497 |
| August | 468 | 478 | 495 |
| September | 465 | 475 | 490 |
| October | 468 | 478 | 495 |
| November | 465 | 475 | 490 |
| December | 468 | 478 | 495 |
Essential Company Information
| Category | Detail |
|---|---|
| Company Name | CrowdStrike Holdings, Inc. |
| Ticker Symbol | CRWD |
| Stock Exchange | NASDAQ |
| Current Stock Price | $333.50 (as of March 7, 2025) |
| Market Capitalization | $82.14 Billion |
| Revenue (ttm) | $3.95 Billion |
| Net Income (ttm) | –$19.27 Million |
| EPS (ttm) | –$0.08 |
| Forward PE Ratio | 96.52 |
| Shares Outstanding | 246.31 Million |
| Beta | 1.19 |
| Analyst Rating | Buy |
| Average Price Target | $398.76 (approximately +19.57% upside) |
| Earnings Date | March 4, 2025 |
| Website | CrowdStrike |
More From Bernini Capital :
- FBND Stock Price Forecast and Prediction (2025–2030)
- AMD Stock Price Prediction and Forecast with Deep Analysis (2025-2030)
- Paypal (PYPL) Stock Price Prediction, Forecast, Detailed Analysis (2025-2030)
- SoFi Technologies (SOFI) Stock Forecast Analysis and Price Target (2025-2030)
Technical Analysis for CRWD Stock
Understanding the technical side of the forecast helps us explain why these predictions make sense. Here’s a closer look at key technical indicators:
Moving Averages
- 50-Day Moving Average:
The current 50-day moving average is around $385.83. This average shows short-term momentum. A price above this level typically signals a positive trend. - 200-Day Moving Average:
The 200-day moving average is approximately $333.48. This long-term indicator provides support and resistance levels. A price that remains above this average may indicate long-term strength.
Relative Strength Index (RSI)
- With an RSI of 30.76, CrowdStrike is nearing oversold conditions. Generally, an RSI below 30 suggests that a stock could be undervalued, offering potential buying opportunities.
Beta and Volatility
- The beta of 1.19 means that CrowdStrike’s price is slightly more volatile than the overall market. This factor leads to sharper price movements, both upward and downward.
Volume and Liquidity
- The average volume over the past 20 days is around 4.7 million shares, indicating good liquidity. This liquidity means that large trades are less likely to cause drastic price changes.
Chart Patterns and Trends
- Historical charts show that CrowdStrike has experienced dramatic swings—from rapid rallies to steep corrections. Key support levels often emerge near previous lows (around $200–$250), while resistance is noted near recent highs (around $450–$475).
- For more detailed chart analysis, platforms like Investing.com provide interactive charts and trend studies.
Bear and Bull Case Scenarios
Investors should always consider both the upside and downside risks. Here are five detailed points for each scenario:
Bear Case (Downside Risks)
- Economic Slowdown:
A global recession could lead to reduced IT spending. If companies cut back on cybersecurity investments, CrowdStrike’s revenue could suffer. - Increased Competition:
The cybersecurity sector is crowded. New entrants or aggressive competitors might erode CrowdStrike’s market share. - Regulatory Challenges:
Changes in data privacy laws or international trade regulations could impact operations and add compliance costs. - High Valuation Risks:
With a forward PE ratio of 96.52, any slowdown in growth may lead to significant price corrections as investors reassess the high valuation. - Technical Corrections:
If the RSI drops further into oversold territory, it could trigger panic selling, leading to sharp short-term declines.
Bull Case (Upside Potential)
- Strong Revenue Growth:
With a 24.23% forecasted revenue growth over five years, increased demand for cybersecurity solutions could boost earnings significantly. - Technological Leadership:
CrowdStrike’s innovative Falcon platform and advanced AI capabilities position it well to capture a growing share of the market. - Positive Analyst Sentiment:
A majority of analysts rate CRWD as “Buy,” with an average price target of $398.76, suggesting strong confidence in its future. - Market Expansion:
As companies continue to digitize their operations, the demand for robust cybersecurity is likely to increase, pushing up CrowdStrike’s sales. - Improved Operational Efficiency:
Enhanced cash flow and strategic investments in research and development could lead to better margins and long-term profitability.
Frequently Asked Questions (FAQ)
Q1. What is CrowdStrike’s current market position?
As of early March 2025, CrowdStrike is trading at $333.50 with a market cap of $82.14 billion. The company is a leader in cloud-delivered cybersecurity solutions, serving customers globally. For more details, visit the CrowdStrike official website.
How do technical indicators influence the forecast?
Technical indicators like the 50-day and 200-day moving averages, RSI, and beta help us understand the stock’s momentum and volatility. These factors are critical in determining support and resistance levels, which in turn shape our monthly predictions.
What are the main risks that could negatively impact CrowdStrike’s stock?
Key risks include economic downturns, increased competition, regulatory hurdles, high valuation risks, and potential technical corrections. These factors might cause short-term or even long-term declines in the stock price.
What factors could drive CrowdStrike’s stock price higher?
Bullish factors include strong revenue growth, technological innovation, positive analyst sentiment, market expansion, and improved operational efficiency. These elements can contribute to a robust long-term upward trend.
Where can I find the most updated information on CrowdStrike?
For the latest data and analysis, check trusted sources like Yahoo Finance, Reuters, and the CrowdStrike official website.
1 thought on “CrowdStrike Holdings, Inc. (CRWD) Stock Price Forecast and Prediction (2025-2030)”