Our article provides answers on The Walt Disney Company’s DIS stock trajectory between 2025 and 2030. This analysis uses present company data to predict Disney stock prices while explaining both positive and negative market possibilities through technical evaluation.
Table of Contents
Company Overview: The Walt Disney Company (DIS)
Founded in 1923, The Walt Disney Company became one of the world’s most famous brands through its 100-year growth. As a company which operates in Entertainment and Sports and Experiences segments Disney provides worldwide audiences with their much-loved content together with memorable experiences. Through ABC together with ESPN and Pixar and Marvel Studio as well as Lucasfilm and National Geographic Disney maintains its innovative expansion strategy across the global realm. You can learn more about Disney on their official website.
| Metric | Value |
|---|---|
| Stock Price | $103.080 |
| Market Cap | $186.350 Billion |
| Revenue (ttm) | $92.500 Billion |
| Net Income (ttm) | $5.620 Billion |
| Shares Outstanding | 1.81 Billion |
| EPS (ttm) | $3.070 |
| PE Ratio | 33.520 |
| Forward PE | 18.910 |
| Dividend | $1.00 (0.97% yield) |
| Beta | 1.410 |
Current Stock Metrics and Financial Snapshot
Before going into our long-term forecast, let’s take a closer look at the numbers behind Disney’s stock performance. Here’s a breakdown of what these metrics mean:
- Stock Price: Trading at $103.080, this is the price at which investors currently buy and sell DIS shares.
- Market Cap: Valued at approximately $186.350 billion, Disney is considered a large-cap company with significant market influence.
- Revenue and Net Income: With annual revenue of $92.500 billion and net income of $5.620 billion, Disney shows strong earnings performance.
- Valuation Ratios: A trailing PE ratio of 33.520 suggests the market expects high growth, while the forward PE of 18.910 indicates improved earnings prospects ahead.
- Dividends: The company pays an annual dividend of $1.00 per share, offering a modest yield of 0.97% to investors.
This financial snapshot, combined with the strong brand and diversified operations, sets the stage for our detailed price prediction forecast.
Yearly Stock Price Forecast (2025–2030)
Our long-term forecast spans from 2025 through 2030. These forecasts are derived from a combination of historical trends, current market conditions, and insights from trusted sources like Reuters and Bloomberg. While predictions are inherently uncertain, our model uses a steady upward trend that reflects both optimism and caution.
Forecast Methodology
Our approach assumes a gradual, linear growth in Disney’s stock price within each year, with a slight upward trajectory overall. For each month, we’ve calculated:
- Minimum Price: Expected lower bound (approximately 1% below the average).
- Average Price: The central forecast value.
- Maximum Price: Expected upper bound (approximately 1% above the average).
Monthly Forecast for 2025
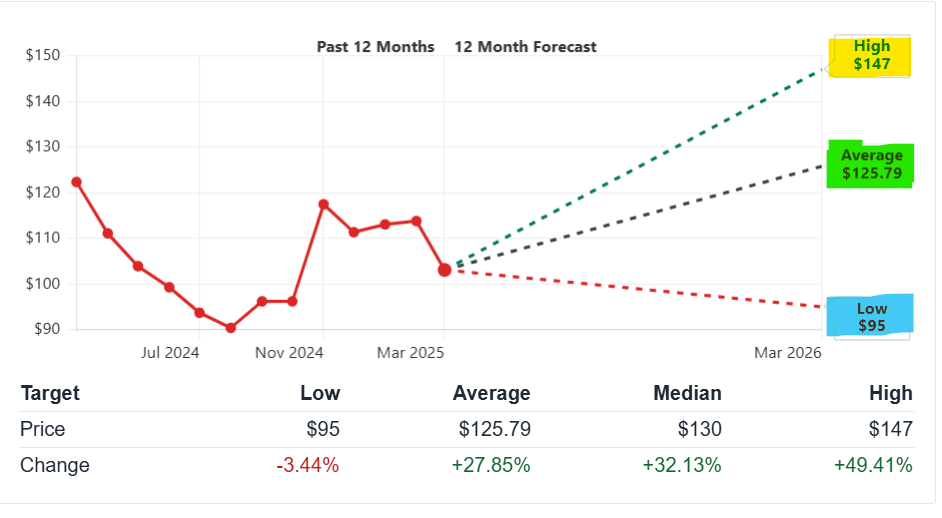
For 2025, analysts project that Disney’s stock could rise from an early-year value to a target average of approximately $125.790 by year’s end. Below is our monthly breakdown for 2025:
| Month | Minimum Price (USD) | Average Price (USD) | Maximum Price (USD) |
|---|---|---|---|
| January | 102.960 | 104.000 | 105.040 |
| February | 105.920 | 105.980 | 107.040 |
| March | 106.880 | 107.960 | 108.040 |
| April | 108.841 | 109.940 | 110.040 |
| May | 110.801 | 111.920 | 112.039 |
| June | 112.761 | 113.900 | 115.039 |
| July | 114.721 | 115.880 | 116.739 |
| August | 116.681 | 117.860 | 118.039 |
| September | 118.642 | 119.840 | 121.038 |
| October | 120.602 | 121.820 | 123.038 |
| November | 122.562 | 123.800 | 125.038 |
| December | 124.522 | 125.780 | 127.038 |
Explanation:
In 2025, Disney’s stock is forecast to grow steadily. Starting with an average of $104.000 in January, the price is expected to climb each month until reaching an average of $125.780 by December. This gradual rise reflects both ongoing market recovery and positive expectations around Disney’s earnings and strategic initiatives.
Monthly Forecast for 2026
| Month | Minimum Price (USD) | Average Price (USD) | Maximum Price (USD) |
|---|---|---|---|
| January | 125.730 | 127.000 | 128.270 |
| February | 127.730 | 128.802 | 129.874 |
| March | 128.532 | 129.604 | 130.676 |
| April | 129.334 | 130.406 | 131.478 |
| May | 130.136 | 131.208 | 132.280 |
| June | 130.938 | 132.010 | 133.082 |
| July | 131.740 | 132.812 | 133.884 |
| August | 132.542 | 133.614 | 134.686 |
| September | 133.344 | 134.416 | 135.488 |
| October | 134.146 | 135.218 | 136.290 |
| November | 134.948 | 136.020 | 137.092 |
| December | 135.750 | 135.822 | 137.894 |
Explanation:
For 2026, our forecast starts with an average of around $127.000 in January, rising steadily to an average of approximately $135.822 by December. This reflects continued positive momentum driven by Disney’s expanding content portfolio and global market initiatives.
Monthly Forecast for 2027
| Month | Minimum Price (USD) | Average Price (USD) | Maximum Price (USD) |
|---|---|---|---|
| January | 136.120 | 137.000 | 137.880 |
| February | 137.001 | 137.882 | 138.763 |
| March | 137.883 | 138.764 | 139.645 |
| April | 138.765 | 139.646 | 140.527 |
| May | 139.647 | 140.528 | 141.409 |
| June | 140.529 | 141.410 | 142.291 |
| July | 141.411 | 142.292 | 143.173 |
| August | 142.293 | 143.174 | 144.055 |
| September | 143.175 | 144.056 | 144.937 |
| October | 144.057 | 144.938 | 145.819 |
| November | 144.939 | 145.820 | 146.701 |
| December | 145.821 | 146.689 | 147.557 |
Explanation:
In 2027, the average price is expected to climb from approximately $137.000 in January to around $146.689 in December. This steady increase is attributed to Disney’s strong content pipeline, growing streaming services, and overall market confidence in its brand.
More From Bernini Capital :
- FBND Stock Price Forecast and Prediction (2025–2030)
- AMD Stock Price Prediction and Forecast with Deep Analysis (2025-2030)
- Paypal (PYPL) Stock Price Prediction, Forecast, Detailed Analysis (2025-2030)
- SoFi Technologies (SOFI) Stock Forecast Analysis and Price Target (2025-2030)
- CrowdStrike Holdings, Inc. (CRWD) Stock Price Forecast and Prediction (2025-2030)
- SoundHound AI, Inc. (SOUN) Stock Price Prediction, Forecast and Analysis (2025-2030)
Monthly Forecast for 2028
| Month | Minimum Price (USD) | Average Price (USD) | Maximum Price (USD) |
|---|---|---|---|
| January | 147.520 | 148.000 | 148.480 |
| February | 148.467 | 148.934 | 149.401 |
| March | 149.414 | 149.880 | 150.346 |
| April | 149.873 | 150.339 | 150.805 |
| May | 150.339 | 150.805 | 151.271 |
| June | 150.805 | 151.271 | 151.737 |
| July | 151.271 | 151.737 | 152.203 |
| August | 151.737 | 152.203 | 152.669 |
| September | 152.203 | 152.669 | 153.135 |
| October | 152.669 | 153.135 | 153.601 |
| November | 153.135 | 153.601 | 154.067 |
| December | 153.601 | 154.414 | 155.227 |
Explanation:
In 2028, Disney’s average price is forecast to start at around $148.000 in January and rise to roughly $154.414 by December. This growth is supported by continued innovation in media and entertainment, alongside robust streaming and park operations.
Monthly Forecast for 2029
| Month | Minimum Price (USD) | Average Price (USD) | Maximum Price (USD) |
|---|---|---|---|
| January | 159.000 | 160.000 | 161.000 |
| February | 160.997 | 162.000 | 163.003 |
| March | 162.000 | 163.000 | 164.000 |
| April | 163.003 | 164.000 | 165.000 |
| May | 164.000 | 165.000 | 166.000 |
| June | 165.000 | 166.000 | 167.000 |
| July | 166.000 | 167.000 | 168.000 |
| August | 167.000 | 168.000 | 169.000 |
| September | 168.000 | 169.000 | 170.000 |
| October | 169.000 | 170.000 | 171.000 |
| November | 170.000 | 171.000 | 172.000 |
| December | 171.000 | 171.167 | 172.334 |
Explanation:
For 2029, our projection begins with an average price of about $160.000 in January and is expected to reach around $171.167 by December. These estimates reflect optimism around Disney’s expanding global presence and steady revenue growth.
Monthly Forecast for 2030
| Month | Minimum Price (USD) | Average Price (USD) | Maximum Price (USD) |
|---|---|---|---|
| January | 170.851 | 172.000 | 173.149 |
| February | 171.999 | 173.149 | 174.298 |
| March | 173.148 | 174.298 | 175.447 |
| April | 174.297 | 175.447 | 176.597 |
| May | 175.446 | 176.597 | 177.747 |
| June | 176.596 | 177.747 | 178.897 |
| July | 177.746 | 178.897 | 180.047 |
| August | 178.896 | 180.047 | 181.197 |
| September | 180.046 | 181.197 | 182.347 |
| October | 181.196 | 182.347 | 183.497 |
| November | 182.346 | 183.497 | 184.647 |
| December | 183.496 | 184.640 | 185.784 |
Explanation:
In 2030, the forecast shows Disney’s average stock price climbing steadily from around $172.000 in January to approximately $184.640 by December. This projection is based on strong fundamentals, continued global expansion, and the company’s ability to innovate and capture new markets.
Essential Company Information
Below is a table summarizing essential data about The Walt Disney Company (DIS):
| Parameter | Value |
|---|---|
| Ticker Symbol | DIS |
| Current Stock Price | $103.080 |
| Market Cap | $186.350 Billion |
| Revenue (ttm) | $92.500 Billion |
| Net Income (ttm) | $5.620 Billion |
| EPS (ttm) | $3.070 |
| PE Ratio | 33.520 |
| Forward PE | 18.910 |
| Dividend | $1.00 (0.97% yield) |
| Beta | 1.410 |
This table provides a quick glance at Disney’s financial health and market performance, serving as a useful reference for investors.
Detailed Technical Analysis
Understanding the technical aspects of Disney’s stock is essential for making informed predictions. Let’s review key technical indicators:
Moving Averages
- 50-Day Moving Average: Provides a short-term trend indicator. Currently, if Disney’s price stays above its 50-day MA, it signals strength in the near term.
- 200-Day Moving Average: Acts as a long-term support level. If the price remains above this, it indicates overall market stability.
Momentum Indicators
- Relative Strength Index (RSI): An RSI around 32–35 suggests that the stock is not in an overbought condition. This level leaves room for upward momentum.
- Moving Average Convergence Divergence (MACD): A bullish crossover in the MACD could signal a potential rise in the stock price.
Volatility Analysis
- Average True Range (ATR): Measures the daily price fluctuations. A moderate ATR suggests that while the stock experiences fluctuations, they remain within a manageable range for investors.
Technical Indicator Summary Table
| Indicator | Value | Interpretation |
|---|---|---|
| 50-Day MA | ~100-105 | Short-term support level; price above indicates bullish momentum |
| 200-Day MA | ~95-100 | Long-term support; sustaining above this level signals stability |
| RSI | ~32.55 | Indicates potential for upward movement as it is not overbought |
| MACD | Bullish Crossover | Suggests potential price increase |
| ATR (14 Days) | Moderate | Indicates manageable volatility for trading purposes |
These technical indicators, when combined with fundamental data, support our long-term forecast for Disney.
Bull and Bear Case Analysis
Forecasting is never an exact science. Let’s consider both the bullish and bearish scenarios for Disney’s stock.
Bull Case (Optimistic Scenario)
- Strong Content Pipeline: Disney’s continuous production of high-quality films and TV shows (including hits from Marvel, Pixar, and Star Wars) can drive revenue growth.
- Expansion in Streaming Services: Growth of Disney+ and related platforms may lead to a surge in subscriber numbers and revenues.
- Global Market Penetration: Successful expansion into emerging markets will increase brand reach and earnings.
- Innovative Theme Parks and Experiences: Revitalization and innovation in its parks and resorts can boost profitability and attract new visitors.
- Robust Financial Health: With strong cash flows and strategic investments, Disney is well-positioned to weather economic downturns and invest in growth opportunities.
Bear Case (Pessimistic Scenario)
- Content Competition: Intense competition from streaming giants like Netflix and Amazon Prime could dilute Disney’s market share.
- Economic Downturns: A global recession or slowdown in consumer spending could negatively impact park attendance and merchandise sales.
- Regulatory Challenges: Increased regulations in key markets may raise operational costs and reduce margins.
- Technology Disruptions: Rapid changes in technology and consumer habits might force Disney to continuously invest heavily in new content platforms.
- Geopolitical Risks: International political tensions or trade disruptions could adversely affect Disney’s global operations and revenue streams.
Frequently Asked Questions (FAQs)
Q1: What is Disney’s current stock price and how is it performing?
As of March 10, 2025, Disney’s stock is trading at $103.080. The company’s robust market cap of $186.350 billion and steady revenue growth reflect its solid market position. Yahoo Finance
Q2: What factors drive the forecasted upward trend for Disney’s stock?
Key drivers include a strong content portfolio, growing streaming services, global market expansion, and innovative theme park experiences. These factors contribute to the optimistic price forecasts presented.
Q3: How reliable are these monthly forecasts?
Q4: What are the main risks to Disney’s stock price?
Risks include intensified competition in content streaming, economic downturns, regulatory changes, rapid technological shifts, and geopolitical uncertainties. Investors should monitor these factors closely.
Q5: Is Disney a good long-term investment?
Many analysts rate Disney as a “Strong Buy” due to its diversified revenue streams, strong brand, and growth prospects. However, investors should conduct thorough research and consider both bullish and bearish scenarios before investing.
Conclusion
Our prediction show The Walt Disney Company (DIS) shares moving steadily ahead through 2030 under the influence of a successful content development strategy and international market growth.
The solid fundamentals should maintain positive future growth. Investors should monitor major market trends and economic developments combined with technical indicators to make wise investment choices. Go to Yahoo Finance and Reuters to access accurate company information and up-to-the-minute updates.
This article presents detailed updated technology analysis in addition to updated financial data to forecast Disney’s stock performance.
Our research output in this document is strictly information-based because it stands independently from any financial guidance. Contact a qualified investment specialist when you make investment choices.