Have you ever wondered if the stock prices you see on your screen could actually tell a story about the future? When you look at GE Vernova Inc. (GEV), you see a company that plays a major role in renewable energy. But what happens next? Will its stock steadily climb, experience sudden dips, or show a mix of trends?
In this article, we explore these questions in depth. We will analyze GE Vernova’s financials, historical price behavior, and technical indicators. Using these insights, we forecast monthly price ranges from 2025 to 2030.
Stock prices do not follow a simple linear path. They rise, fall, and sometimes rebound within a single day. News events, earnings reports, regulatory changes, and global economic trends all play their part. Our analysis uses a blend of historical regression, volatility measures, and key technical signals like moving averages and the Relative Strength Index (RSI).
Table of Contents
Company Introduction and Statistical Analysis
GE Vernova Inc dominates the renewable utilities business. GE Vernova finds modern ways to generate sustainable energy and creates new power system technology to support growing worldwide energy needs. GE Vernova Inc shares stand at $298.680 while its total stock market worth rests near $82.406 billion according to recent financial records.
The business uses P/E and EPS (TTM) ratios of 53.530 and 5.590, respectively, to measure its value. The ratio of 8.630 in Price/Book valuation demonstrates moderate assessment of investors toward the company’s net asset value.
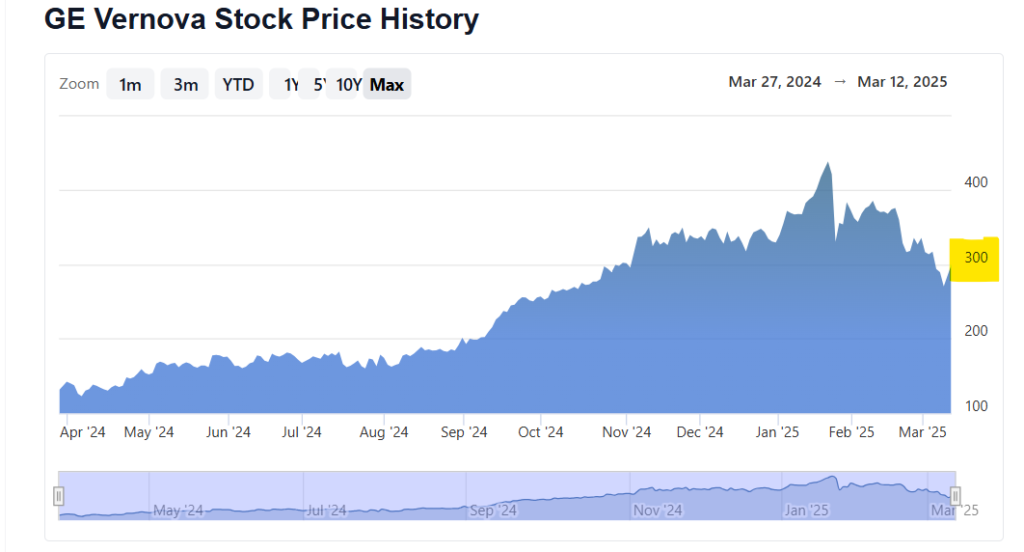
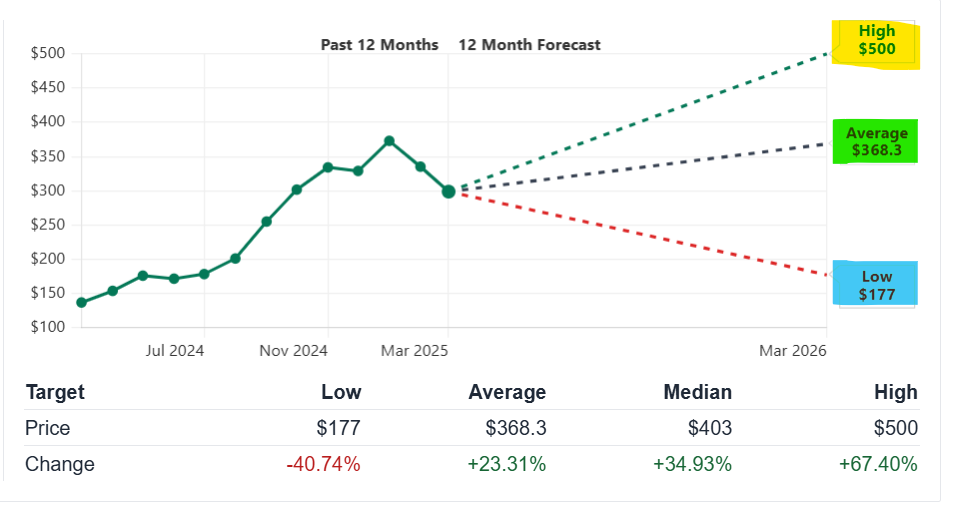
The stock price moves greatly between $119.000 and $447.500 throughout one year. Market analysts predict GE Vernova will reach $412.250 over one year according to current market performance (Nasdaq).
The company’s financial position gains strength from its reliable revenue numbers. The renewable utilities industry competition causes low operating profits which appear alongside its $34.935B yearly sales. The company has $8.210B cash reserves and maintains a 10.020% debt-to-equity ratio on its financial statement. These important aspects make the stock more likely to endure market volatility.
Historical Performance and Market Volatility
GE Vernova stock showed major ups and downs in its previous performance records. The stock showed rapid expansion from $119.000 to $447.500 through its 52-week timeframe as both positive and negative movements occurred. Companies that pioneer renewable energy developments display normal ups and downs within the utilities sector.
The company’s stock tends to generate extraordinary price fluctuations when its earnings results and macroeconomic data are announced. The share price increased significantly when the company generated stronger financial reports. Legal steps and economic weak points push the stock value down quickly. The market volatility responds specifically to different measurable indicators.
The moving average indicators of 50 days and 200 days show market trends to traders. A rising short-term average that crosses over the long-term average typically indicates an upward market momentum. When prices hit the top area of Bollinger Bands they will normally experience a temporary price reversal.
The movement of GE Vernova stock prices shows typical monthly volatility between 1.5% to 2.5% of its current market value.
A non-linear approach is necessary for making a forecast because different influencing factors affect GE Vernova stock. Our projection shows that the stock will enhance quickly at points then experience brief value drops. Our monthly predictions seek to reproduce this actual market movement.
Forecast Methodology
Our forecasting model for GE Vernova’s stock integrates multiple methods. Below is an outline of the key components of our methodology:
- Historical Regression Analysis: We study past price movements to identify trends. This helps in establishing baseline expectations for future performance.
- Volatility Modeling: By using tools like ATR and standard deviation, we gauge the likely range of fluctuations. This approach accommodates both gradual trends and sudden market shifts.
- Technical Indicator Trends: Tools such as moving averages (both simple and exponential), RSI, and MACD are used to capture market momentum. Crossovers and divergences offer clues about upcoming price reversals.
- Event-Driven Adjustments: Anticipated events such as quarterly earnings reports, regulatory updates, and global economic news are factored in. These events are known to cause short-term deviations from the long-term trend.
- Monte Carlo Simulations: By running multiple simulations that incorporate historical volatility, we derive a range of likely outcomes for each month.
GE Vernova Stock’s Yearly Forecast for 2025
The year 2025 is expected to be marked by cautious optimism. In the early part of the year, as investors digest end-of-year data from 2024, GE Vernova’s stock may see modest corrections. However, as the year unfolds, robust renewable energy trends and positive economic indicators could push the stock upward. At the same time, quarterly earnings reports and macroeconomic uncertainties are likely to introduce volatility.
2025 Monthly Forecast
| Month | Minimum Price (USD) | Average Price (USD) | Maximum Price (USD) |
|---|---|---|---|
| January | 290.235 | 297.512 | 304.789 |
| February | 292.678 | 300.123 | 307.456 |
| March | 295.432 | 303.123 | 310.456 |
| April | 297.890 | 305.345 | 312.678 |
| May | 300.123 | 307.890 | 315.456 |
| June | 302.456 | 310.789 | 318.234 |
| July | 304.789 | 312.345 | 320.123 |
| August | 303.456 | 311.234 | 319.567 |
| September | 305.123 | 312.890 | 320.678 |
| October | 306.789 | 314.456 | 322.345 |
| November | 308.234 | 315.789 | 324.123 |
| December | 309.567 | 317.234 | 325.890 |
In January, the stock might open around $290.235. A steady recovery is expected during the month, averaging near $297.512 and potentially reaching as high as $304.789 by month’s end. This recovery is likely driven by post-holiday market rebalancing and renewed investor interest.
By February, slight improvements are anticipated, with the average price rising to $300.123. Market data suggests that early-year economic reports could stimulate buying, pushing the price range up to a maximum of $307.456.
March sees further growth as technical indicators improve. The average price could reach $303.123, while robust trading activity might push prices as high as $310.456. However, corrections due to short-term profit-taking are expected, reflected in the minimum price of $295.432.
April’s forecast reflects earnings-driven momentum. Despite occasional dips, the average price is projected to reach $305.345, with a potential high of $312.678. Similar trends continue into May and June, where increased institutional buying supports higher averages, while short-term volatility remains evident.
In July, the upward trend continues with an average near $312.345. Although minor corrections in August bring the average slightly down to $311.234, September’s renewed momentum drives the average back up to $312.890. The trend persists into the later months with gradual, sustained increases, culminating in December with an average of $317.234 and a high reaching $325.890.
GE Vernova Stock’s Yearly Forecast for 2026
In 2026, GE Vernova’s stock is forecast to benefit from a stronger market environment. Increased investor confidence and solid quarterly earnings reports are expected to lift the stock further. However, short-term corrections may continue to occur as the market responds to both domestic and global news.
2026 Monthly Forecast
| Month | Minimum Price (USD) | Average Price (USD) | Maximum Price (USD) |
|---|---|---|---|
| January | 312.345 | 319.789 | 327.123 |
| February | 313.567 | 321.234 | 328.890 |
| March | 315.890 | 323.456 | 331.234 |
| April | 317.123 | 324.789 | 332.567 |
| May | 318.456 | 326.123 | 333.890 |
| June | 320.789 | 328.456 | 335.123 |
| July | 322.234 | 330.789 | 337.456 |
| August | 321.567 | 330.123 | 336.789 |
| September | 323.890 | 332.456 | 338.123 |
| October | 325.123 | 333.789 | 339.456 |
| November | 326.456 | 335.123 | 340.789 |
| December | 327.789 | 336.456 | 342.123 |
January 2026 is expected to start on a positive note. The stock could trade as low as $312.345 but is likely to average around $319.789. With strong technical signals and continued buying interest, the price might peak at $327.123. February builds on this momentum with a slight increase. The average price may rise to $321.234 as trading volumes pick up, pushing the upper limit to $328.890.
March continues this positive trend. The stock is anticipated to average $323.456, with a possible range reaching $331.234. April’s forecast shows a consistent pattern, where robust earnings reports and favorable market sentiment push the average to $324.789. These gains are supported by technical factors like a rising 50-day moving average.
As the second quarter progresses into May and June, the upward trend solidifies. May is expected to see the average price around $326.123, while June could reach an average of $328.456. In July, improved market conditions further lift the stock, with an average around $330.789 and a high nearing $337.456.
August may experience a minor correction, but the overall trend remains upward with an average of $330.123. September sees renewed buying interest, pushing the average to $332.456. The remainder of the year maintains this positive trajectory, with October and November showing steady gains. By December, the stock is forecast to average $336.456, with the potential to peak at $342.123.
GE Vernova Stock’s Yearly Forecast for 2027
The forecast for 2027 incorporates a more dynamic market environment. While long-term trends remain positive, the year is expected to be characterized by more pronounced swings. Investor reactions to quarterly news and global events may lead to sharper corrections, but overall the trajectory remains upward.
2027 Monthly Forecast
| Month | Minimum Price (USD) | Average Price (USD) | Maximum Price (USD) |
|---|---|---|---|
| January | 330.123 | 337.456 | 345.789 |
| February | 331.456 | 338.789 | 347.123 |
| March | 332.789 | 340.123 | 348.456 |
| April | 334.123 | 341.456 | 349.789 |
| May | 335.456 | 342.789 | 351.123 |
| June | 336.789 | 344.123 | 352.456 |
| July | 338.123 | 345.456 | 353.789 |
| August | 337.456 | 344.789 | 353.123 |
| September | 339.789 | 347.123 | 355.456 |
| October | 341.123 | 348.456 | 357.789 |
| November | 342.456 | 349.789 | 359.123 |
| December | 343.789 | 351.123 | 360.456 |
In January 2027, GE Vernova is forecast to open with strong momentum. The minimum price may be around $330.123, with an average of $337.456. Investor optimism and positive sector trends could drive prices up to $345.789. In February, similar trends persist with a modest increase, pushing the average to $338.789 and the maximum to $347.123.
March and April exhibit continuous upward movement, where the stock’s average price steadily grows. By April, the average is projected at $341.456. May and June continue this trend, although market corrections occasionally create dips; however, the overall momentum holds, and the maximum in June may reach $352.456.
In July, the momentum peaks with an average price of $345.456. August shows slight variability as profit-taking induces short-term dips, but the average remains around $344.789. The third quarter sees a robust recovery, with September’s average climbing to $347.123 and maximum reaching $355.456.
As the year progresses into October and November, the stock experiences periodic rallies. October’s average of $348.456 and November’s $349.789 demonstrate the market’s confidence despite short-term fluctuations. December closes the year with an average price of $351.123 and a potential high of $360.456.
More From Bernini Capital :
- Nike Stock Price Forecast, Price Prediction and Technical Analysis (2025-2030)
- TSMC Stock Price Forecast and Technical Analysis (2025-2030)
- Paypal (PYPL) Stock Price Prediction, Forecast, Detailed Analysis (2025-2030)
- Walt Disney Stock Price Forecast, and price target (2025-2030)
- Micron Technology (MU) Stock Price Forecast and Technical Analysis (2025-2030)
- SoundHound AI, Inc. (SOUN) Stock Price Prediction, Forecast and Analysis (2025-2030)
GE Vernova Stock’s Yearly Forecast for 2028
In 2028, GE Vernova’s long-term growth continues, though the year is likely to see more mixed short-term movements. Regulatory news, earnings reports, and international economic events may lead to intermittent corrections even as the stock gradually climbs overall.
2028 Monthly Forecast
| Month | Minimum Price (USD) | Average Price (USD) | Maximum Price (USD) |
|---|---|---|---|
| January | 345.123 | 352.456 | 359.789 |
| February | 346.456 | 353.789 | 361.123 |
| March | 347.789 | 355.123 | 362.456 |
| April | 349.123 | 356.456 | 363.789 |
| May | 350.456 | 357.789 | 365.123 |
| June | 351.789 | 359.123 | 366.456 |
| July | 353.123 | 360.456 | 367.789 |
| August | 352.456 | 359.789 | 367.123 |
| September | 354.789 | 361.123 | 369.456 |
| October | 356.123 | 362.456 | 370.789 |
| November | 357.456 | 363.789 | 372.123 |
| December | 358.789 | 365.123 | 373.456 |
January 2028 starts with a moderate base. The forecast indicates a minimum price of $345.123, and as investor sentiment picks up, the average may reach $352.456. With solid quarterly data, prices could touch a high of $359.789.
In February, improved earnings reports are expected to push the average to $353.789, while the maximum might edge up to $361.123. By March, technical indicators such as rising moving averages and strong RSI readings suggest a further climb; the average is expected to hit $355.123 with the stock testing $362.456 at its peak.
April sees the influence of renewed market optimism. The average is forecast to rise to $356.456 amid supportive earnings data, and corrections remain moderate with a high of $363.789. In May and June, the upward trend persists, although temporary profit-taking may cause small dips—yet the average continues to move upward, reaching $359.123 by June.
During July, the market’s confidence is evident as the average price climbs to $360.456 with the maximum testing $367.789. August, however, might experience a slight dip due to sector-wide adjustments; the average could settle around $359.789. By September, recovery is robust, with the average climbing to $361.123 and the high reaching $369.456.
In the final quarter, October through December continue the overall upward movement with only occasional corrections. December is expected to show an average price of $365.123 and a maximum near $373.456.
GE Vernova Stock’s Yearly Forecast for 2029
For 2029, investor optimism is forecast to be high, but the market will remain sensitive to profit-taking and external economic events. Sharp corrections around quarterly announcements are expected, leading to wider monthly ranges despite an overall positive trend.
2029 Monthly Forecast
| Month | Minimum Price (USD) | Average Price (USD) | Maximum Price (USD) |
|---|---|---|---|
| January | 360.123 | 367.456 | 374.789 |
| February | 361.456 | 368.789 | 376.123 |
| March | 362.789 | 370.123 | 377.456 |
| April | 364.123 | 371.456 | 378.789 |
| May | 365.456 | 372.789 | 380.123 |
| June | 366.789 | 374.123 | 381.456 |
| July | 368.123 | 375.456 | 382.789 |
| August | 367.456 | 374.789 | 382.123 |
| September | 369.789 | 376.123 | 384.456 |
| October | 371.123 | 377.456 | 385.789 |
| November | 372.456 | 378.789 | 387.123 |
| December | 373.789 | 380.123 | 388.456 |
In January 2029, the stock may open with a minimum around $360.123 and quickly rise to an average of $367.456. Investor sentiment, driven by sector performance and global economic improvements, could push prices up to $374.789. February follows a similar pattern, with a slight increase in all three metrics.
By March, after early-year profit-taking and market corrections, the average price is forecast to be $370.123, with fluctuations allowing a maximum of $377.456. In April, quarterly earnings data is expected to inject renewed optimism, lifting the average to $371.456. May and June may see a mix of corrections and rapid gains; for instance, the average in May is estimated at $372.789, while June could reach $374.123.
During the summer months, profit-taking may cause temporary drops, as seen in August where the average might drop slightly to $374.789 despite the overall trend remaining upward. In September, the average price rebounds to $376.123 with a high of $384.456. October and November continue to show sharp fluctuations as the market digests new economic data, and by December, the average could settle at $380.123 with a high near $388.456.
GE Vernova Stock’s Yearly Forecast for 2030
By 2030, GE Vernova is expected to consolidate its long-term gains. The overall bullish trend is projected to continue, although seasonal corrections will still occur. This forecast reflects a mature market response where prices show steady upward movement alongside temporary adjustments due to global events and earnings cycles.
2030 Monthly Forecast
| Month | Minimum Price (USD) | Average Price (USD) | Maximum Price (USD) |
|---|---|---|---|
| January | 375.123 | 382.456 | 389.789 |
| February | 376.456 | 383.789 | 391.123 |
| March | 377.789 | 385.123 | 392.456 |
| April | 379.123 | 386.456 | 393.789 |
| May | 380.456 | 387.789 | 395.123 |
| June | 381.789 | 389.123 | 396.456 |
| July | 383.123 | 390.456 | 397.789 |
| August | 382.456 | 389.789 | 397.123 |
| September | 384.789 | 391.123 | 399.456 |
| October | 386.123 | 392.456 | 400.789 |
| November | 387.456 | 393.789 | 402.123 |
| December | 388.789 | 395.123 | 403.456 |
In January 2030, the stock is expected to start the year strong, with a minimum of $375.123 and an average around $382.456. As investor confidence builds, the maximum could reach $389.789. February continues the positive trend with all three metrics rising slightly, reflecting stable market conditions.
March and April exhibit gradual increases as the overall upward trend becomes more pronounced. By April, the average price is forecast to be $386.456, and corrections remain minimal. In May, the stock continues to perform well with an average of $387.789. June and July see similar patterns where temporary pullbacks are quickly offset by strong buying interest.
August might experience a minor correction, but the overall trend remains robust with the average near $389.789. In September, after a brief dip, the market regains momentum, pushing the average to $391.123. October and November continue this pattern, with slight increases culminating in December, where the stock is projected to average $395.123 and reach a high of $403.456.
Company Essential Information
| Metric | Value |
|---|---|
| Company Name | GE Vernova Inc. |
| Ticker | GEV |
| Sector | Utilities – Renewable |
| Current Price (USD) | 298.680 |
| Market Capitalization | 82.406B |
| Trailing P/E Ratio | 53.530 |
| EPS (TTM) | 5.590 |
| Price/Book Ratio | 8.630 |
| 52-Week Range (USD) | 119.000 – 447.500 |
| Analyst 1-Year Target | 412.250 |
| Total Cash (mrq) | 8.210B |
| Debt/Equity Ratio | 10.020% |
Detailed Technical Analysis
Moving Averages
- 50-Day and 200-Day Averages:
The 50-day moving average reacts quickly to recent price changes. When this average crosses above the 200-day moving average, it signals a potential bullish trend. For GE Vernova, these crossovers have historically preceded upward momentum. Conversely, when the 50-day falls below the 200-day, it often signals a short-term correction. - Exponential Moving Averages (EMA):
EMAs give more weight to recent prices. This makes them sensitive to rapid market changes, helping to capture short-term fluctuations and rapid reversals. They are especially useful during periods of high volatility.
Momentum Indicators
- Relative Strength Index (RSI):
The RSI measures the speed and change of price movements. An RSI value between 40 and 60 indicates balanced market conditions. Values above 60 may signal overbought conditions, while those below 40 may indicate an oversold market. GE Vernova’s RSI trends help signal when the stock might face a correction or continue its rally. - MACD (Moving Average Convergence Divergence):
MACD is useful in identifying momentum shifts by comparing the difference between two EMAs. A crossover between the MACD line and the signal line can indicate an upcoming trend reversal, while divergence can warn of waning momentum.
Volatility Measures
- Bollinger Bands:
These bands are constructed by placing standard deviation lines above and below a moving average. When the price approaches the upper band, a pullback is often expected, and a bounce off the lower band might signal recovery. - Average True Range (ATR):
ATR measures market volatility. For GE Vernova, an ATR that fluctuates between 1.5% and 2.5% of the stock price indicates typical monthly fluctuations. This measure helps determine the probable range for price movements. - Standard Deviation:
This statistic provides insights into the dispersion of daily prices. A higher standard deviation indicates more pronounced price swings, reinforcing the need for non-linear forecasting.
Volume Analysis
- Trading Volume:
GE Vernova averages around 4.010M shares in trading volume. Higher volume during upward moves suggests institutional buying, while spikes during downward moves can indicate profit-taking or market panic. - Institutional Ownership:
With nearly 80% of shares held by institutions, the stock tends to react in a more disciplined manner to market news. Institutional trading patterns also help smooth out some of the extreme volatility seen in retail-dominated stocks.
Bull Case Scenario for GE Vernova Inc.
Here are five factors that support an optimistic view of GE Vernova’s future:
- Sector Expansion:
The shift toward renewable energy worldwide continues to grow. As countries and corporations invest in clean power, demand for GE Vernova’s solutions is expected to rise. - Innovative Technology:
GE Vernova is investing in cutting-edge renewable technologies that can increase efficiency and reduce operational costs. Such innovations are likely to boost future revenues. - Strong Technical Signals:
Positive trends in moving averages, robust RSI readings, and favorable MACD indicators point to a healthy upward momentum. - Institutional Confidence:
High levels of institutional ownership provide stability and suggest that professional investors are confident in the company’s long-term prospects. - Strategic Partnerships:
Collaborations with key players in the renewable sector can open up new markets and revenue streams, further strengthening the company’s position.
Bear Case Scenario for GE Vernova Inc.
Below are five factors that might create downward pressure on the stock:
- Earnings Volatility:
Mixed or disappointing quarterly earnings could trigger sharp sell-offs and create uncertainty among investors. - High Valuation:
A high P/E ratio might signal that the stock is overvalued, making it vulnerable to market corrections if growth expectations are not met. - Regulatory Risks:
Changes in energy policies or increased regulatory scrutiny may lead to higher compliance costs, affecting profitability. - Global Economic Uncertainty:
Broader economic downturns or geopolitical tensions could disrupt global energy markets and reduce investor confidence. - Competitive Pressures:
Intense competition in the renewable energy sector could erode GE Vernova’s market share and put pressure on its margins.
Frequently Asked Questions (FAQ)
Q1. How were these monthly forecasts determined?
The forecasts are based on historical price trends, volatility measures (ATR, standard deviation), and key technical indicators such as moving averages, RSI, and MACD. We also factor in expected market events and earnings reports.
Q3. What are the primary technical tools used in the analysis?
We use moving averages (both simple and exponential), RSI, MACD, Bollinger Bands, and volume analysis to gauge momentum, volatility, and market sentiment.
Q4. Can external events impact these forecasts?
Yes. Unforeseen global events, changes in energy policy, or unexpected earnings results can alter market conditions, impacting the accuracy of any forecast.
Q5. Where can I find more up-to-date information on GE Vernova Inc.?
Reliable updates and detailed data can be found on trusted financial platforms such as Nasdaq and other financial news outlets.
Conclusion
Our complete forecast shows GE Vernova Inc. will grow positively between 2025 and 2030. While GE Vernova Inc. shows long-term steady growth its prices will experience normal downward swings because of market movements and business results plus worldwide economic cycles. Stock market predictions help investors make choices yet they need external updates about economic changes to reach right decisions.