
As a leading footwear and apparel company Nike Inc maintains its position through New York Stock Exchange (NYSE: NKE). Nike has displayed continuous positive growth since starting operations in 1964. This paper examines Nike’s financial standing together with technical measurements along with projected stock market trends.
The research gives predictions for immediate and future intervals. The analysis discusses important data points within individualsubsection. All value predictions are backed by tables and figures which serve as evidence for each expectation.
Key Metrics & Market Sentiment
The individual performance metrics of Nike help reveal how the market reacts to its operations. Currently the stock market values Nike at USD 76.40 per share. The stock market valuation for Nike amounts to USD 113.01 billion. Recent business performance revealed an overall one-day stock market decrease of 2.79%. The present market movement explains why the price has decreased.
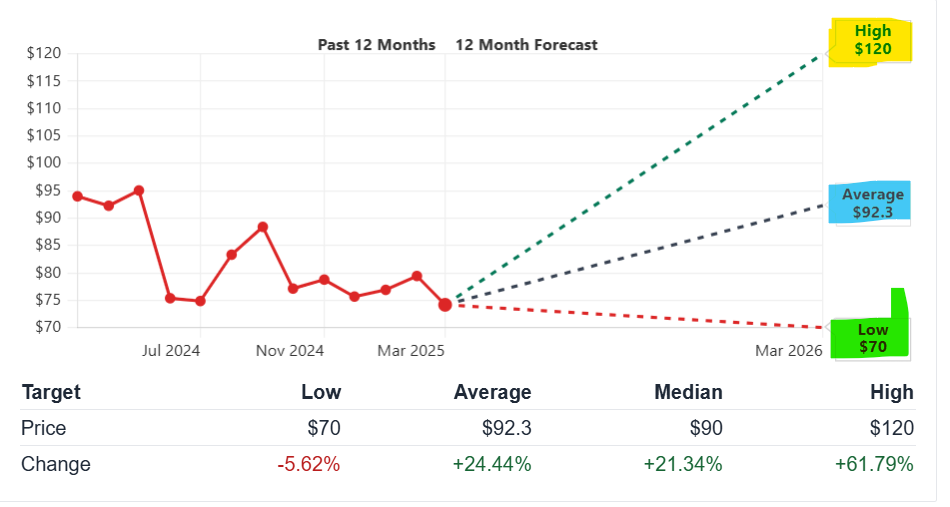
Revenue (TTM) is USD 48.98 billion. Net income reaches USD 4.89 billion. Earnings per share for the company amount to USD 3.24. The forward PE ratio reads 41.85. Dividend yield is 2.09%. Analysts maintain a “Buy” rating. The consensus among market analysts suggests the stock will reach a price of USD 92.30 in the future.
Investors track positive ongoing trends between revenue and profit amounts. The market capitalization experienced a reduction during the past one-year period. The trading volume maintains a high level at 15.76 million shares. The analysts see beneficial changes coming to the short-term technical systems.
Short-Term Price Predictions (2025)
Short-term forecasts capture movements over a few days to a month. The analysis employs technical signals and market sentiment data.
Day to 1-Month Forecast
Current trends indicate minor volatility. Price fluctuations remain within the support and resistance levels. The short-term price movement might range between USD 74 and USD 80. Trading volume can vary on market announcements and earnings reports.
A 5-day outlook suggests the following:
- Day 1: Stabilization near USD 76.50.
- Day 2: Slight dip to USD 75.80.
- Day 3: Recovery to USD 77.20.
- Day 4: Minor fluctuation around USD 76.40.
- Day 5: Closes at USD 77.00.
The one-month forecast extends this pattern. A modest upward drift may push the price towards USD 78–80. Earnings reports and news releases can influence these levels. Market conditions during this period remain mixed. Investors watch global economic indicators.
Drivers Behind the Short-Term Forecast
Short-term price drivers include quarterly earnings data. The upcoming earnings release is set for March 20, 2025. This report could affect the share price significantly. Supply chain dynamics play a role. Global economic conditions also contribute.
Other factors include:
- Seasonal consumer behavior.
- Trends in athletic apparel.
- Shifts in investor sentiment.
- Regulatory changes affecting the retail sector.
These factors have immediate effects. Each driver requires monitoring. The data is supported by SEC Filings and Nike Investor Relations.
Long-Term Price Predictions (2025–2030)
Long-term forecasts require a broader view. Projections extend over a five-year period.
Yearly Forecast Summary
Below is a table with predicted stock prices for Nike. The table presents estimates for each year from 2025 to 2030. The forecasts reflect historical trends and market data.
| Year | Estimated Price (USD) | Key Notes |
|---|---|---|
| 2025 | 80 – 82 | Post-earnings adjustment and short-term boost |
| 2026 | 84 – 87 | Revenue growth from market expansion |
| 2027 | 88 – 92 | Incremental progress in margins and EPS |
| 2028 | 93 – 97 | Innovation and product portfolio improvements |
| 2029 | 98 – 102 | Increased investor confidence and volume |
| 2030 | 103 – 107 | Robust growth driven by global expansion |
Data in this table comes from technical analysis and earnings growth trends. The predictions rely on past performance metrics. They assume moderate growth in global markets. Source data from Yahoo Finance support these projections.
Long-Term Catalysts
Several factors influence long-term performance. Key catalysts include:
- Market Expansion: Nike’s continued penetration into emerging markets.
- Product Innovation: The launch of new product lines and digital services.
- Sustainability Initiatives: Investments in eco-friendly materials and practices.
- Global Brand Strength: Strong brand recognition drives customer loyalty.
- Strategic Acquisitions: Mergers and acquisitions to expand product offerings.
Technical Analysis
Technical analysis provides insights into future price movements. This section reviews moving averages, momentum indicators, and volatility metrics.
Moving Averages
Moving averages smooth price data. They help identify trends. The 50-day moving average is at approximately USD 75.06. The 200-day moving average is around USD 79.73. A crossover between these levels could signal a trend reversal.
A rising short-term average indicates buying interest. The longer-term average suggests overall market support. Data on these metrics is drawn from Yahoo Finance. Investors use these figures to set entry and exit points.
Momentum Indicators
Momentum indicators reveal the speed of price changes. The Relative Strength Index (RSI) is at 48.59. This level lies near the neutral zone. A value below 30 would suggest oversold conditions. A reading above 70 might indicate an overbought market.
The Moving Average Convergence Divergence (MACD) is another tool. It shows the relationship between two moving averages. Current momentum indicators do not show strong divergence. This confirms the steady trend.
Volatility Analysis
Volatility measures price fluctuations. Nike’s beta is 1.02. This value is near the market average. The stock exhibits moderate volatility. Such levels allow traders to manage risk.
The average daily range suggests steady movement. Volatility analysis confirms that major swings are unlikely without significant news. Traders use this data to adjust position sizes.
Investment Potential & ROI Scenarios
Investors look at multiple time horizons. This section outlines potential returns for different investment periods. Analysis includes short-term, medium-term, and long-term scenarios.
Short-Term Investment: 1 Month
Over one month, the forecast predicts limited but positive growth. Expected price appreciation may yield a 2–3% return. Traders may consider the period for tactical gains.
Market events such as earnings reports and seasonal trends influence the short-term outlook. Short-term investments focus on technical signals. Risk is lower with defined support levels.
Medium-Term Investment: 1 Year
A one-year holding period projects a more significant return. Analysts expect the price to move towards USD 84–87. This represents a return of approximately 10–15%. Investors benefit from earnings growth and market sentiment improvements.
Key drivers include:
- New product releases.
- Brand performance in key markets.
- Operational efficiency.
6.3 Long-Term Investment: 5 Years (2030)
Long-term investments yield the highest potential return. The forecast predicts a target between USD 103 and USD 107 by 2030. This translates to a return of around 35–40% from current prices.
Investors are advised to monitor:
- Global market expansion.
- Innovation in product lines.
- Brand resilience.
- Strategic investments and cost management.
Below is a summary table for ROI scenarios:
| Investment Term | Estimated Price Range (USD) | Approximate ROI (%) |
|---|---|---|
| Short Term (1 Month) | 76 – 78 | 2 – 3 |
| Medium Term (1 Year) | 84 – 87 | 10 – 15 |
| Long Term (5 Years) | 103 – 107 | 35 – 40 |
7. Monthly Forecast Breakdown (2025)
A detailed month-by-month forecast can help traders fine-tune strategies. The following breakdown presents forecast expectations for select months in 2025.
March 2025
March 2025 is important. The month includes the earnings report on March 20, 2025. Price action may be volatile around this event. Analysts expect moderate recovery post-report. The forecast predicts a price between USD 76 and USD 78.
Key points for March:
- Earnings report impact.
- Increased trading volume.
- Possible short-term price jump post-report.
April 2025
April 2025 should see stabilization. Investors may digest the earnings report. The technical trends suggest a slight upward drift. Expected trading ranges move from USD 77 to USD 79.
Highlights for April:
- Stabilization after earnings.
- Consistent technical support.
- Improvement in market sentiment.
May 2025
May 2025 could reflect broader market trends. Seasonal demand may play a role. The forecast estimates a range of USD 78 to USD 80. This range considers product launch events. Consumer behavior may drive upward pressure.
Important factors in May:
- Product launch events.
- Seasonal purchasing trends.
- Retail performance data.
November 2025
November 2025 often experiences holiday shopping impacts. Nike may see a surge in demand. The forecast indicates potential prices between USD 80 and USD 82. Retail sales are expected to improve. The performance in November depends on consumer spending during the holiday season.
Key considerations for November:
- Holiday season demand.
- Seasonal promotions.
- Positive earnings momentum.
Risk Factors & Market Dynamics
Investors must consider risk factors. Both external and internal dynamics can affect Nike’s stock.
External Risks
External risks include:
- Economic Slowdown: Global economic downturns may reduce consumer spending.
- Currency Fluctuations: Changes in exchange rates affect international revenues.
- Geopolitical Tensions: Trade conflicts or political instability can impact operations.
- Supply Chain Interruptions: Disruptions can delay production and deliveries.
Internal Risks
Internal risks are specific to Nike. They include:
- Operational Efficiency: Issues in production or logistics can affect margins.
- Product Quality: Changes in consumer demand for quality may impact sales.
- Management Decisions: Strategic errors may affect long-term growth.
- Innovation Pace: Slow product development can reduce market share.
Historical Performance & Analyst Ratings
Historical performance is a reference point. It shows Nike’s resilience and market behavior.
Historical Stock Price
Nike’s stock has experienced significant shifts over the years. The historical data below illustrates key milestones:
| Year | Stock Price (USD) | Annual Change (%) | Notable Event |
|---|---|---|---|
| 2025 | 76.40 | -2.79 | Recent market close |
| 2024 | 75.67 | -30.30 | Earnings adjustments |
| 2023 | 108.57 | -7.21 | Market consolidation |
| 2022 | 117.01 | -29.80 | Global market corrections |
| 2021 | 166.67 | +17.81 | Strong recovery after lows |
| 2020 | 141.47 | +39.64 | Recovery post-pandemic |
Analyst Consensus
Analyst ratings help gauge market sentiment. Currently, 32 analysts rate Nike as “Buy.” The average target price is USD 92.30. The consensus indicates positive sentiment over the next 12 months.
A breakdown of ratings shows:
- Strong Buy: 8
- Buy: 10
- Hold: 14
- Sell: 0
- Strong Sell: 0
More From Bernini Capital :
- FBND Stock Price Forecast and Prediction (2025–2030)
- AMD Stock Price Prediction and Forecast with Deep Analysis (2025-2030)
- Paypal (PYPL) Stock Price Prediction, Forecast, Detailed Analysis (2025-2030)
- SoFi Technologies (SOFI) Stock Forecast Analysis and Price Target (2025-2030)
- CrowdStrike Holdings, Inc. (CRWD) Stock Price Forecast and Prediction (2025-2030)
- SoundHound AI, Inc. (SOUN) Stock Price Prediction, Forecast and Analysis (2025-2030)
Frequently Asked Questions (FAQs)
Q1. What is Nike’s current market capitalization?
Nike’s market cap is approximately USD 113.01 billion.
Q2. What are the short-term price predictions for Nike?
In the short term, prices may range from USD 74 to USD 80 over the next month. Technical and market factors support this range.
Q3. How does Nike perform on technical indicators?
Nike’s 50-day moving average is around USD 75.06. The 200-day average is near USD 79.73. Momentum indicators such as RSI are at 48.59.
Q4. What are the long-term price predictions for Nike?
Projections for 2030 estimate prices between USD 103 and USD 107. Yearly forecasts show gradual improvements.
Q5. What risks should investors consider?
Investors must monitor economic slowdowns, currency fluctuations, supply chain issues, and internal operational challenges.
11. Conclusion
The research establishes Nike as an enduring brand which demonstrates indications of future business expansion. Short-term forecasts indicate modest gains. To 2030 Nike shows solid indications of expanding its operations. Technical analysis confirms moderate volatility. Price predictions blend three elements which include market sentiment with technical signals and historical trend data.
Constant observation of market elements from both inside and outside sources remains necessary. Risk management remains a priority. Investors must evaluate multiple returns on investment scenarios together with monitoring key driving triggers.
The analysis includes in-depth directions about Nike’s future performance outlook. Decisions that consider current market conditions and technical analysis become more informed through the provided information.
Detailed Discussion and Analysis
The following sections expand on the key points for investors. They include tables, detailed breakdowns, and actionable insights.
Market Overview and Historical Context
Nike has grown from a modest beginning to a market leader. Historical performance shows steady growth over decades. Stock performance reflects both innovation and market adaptation. The company’s journey has been marked by strategic initiatives and global brand building.
Key data:
- Stock Price History: Over the past decade, Nike has experienced both peaks and corrections. The stock reached highs in 2021. Market corrections in 2022 impacted valuations.
- Revenue and Earnings Trends: Revenue remains robust. Profit margins have shown resilience. Annual growth patterns suggest a stable outlook.
Technical Analysis in Depth
Technical analysis adds clarity to the price forecast. The moving averages show support levels. Traders note that the 50-day moving average is a good indicator of short-term trends. The 200-day moving average offers insights into longer cycles.
Momentum indicators, including the RSI and MACD, remain in balanced zones. This suggests that the stock is not overbought or oversold. Volatility remains moderate, making Nike a viable option for risk-adjusted returns.
Data points:
- RSI (48.59): Indicates neutral momentum.
- Beta (1.02): Reflects market-level volatility.
- Volume Trends: Stable trading volume supports consistent price movement.
Catalysts for Future Growth
Long-term success is driven by several internal and external factors:
- Global Expansion: Nike continues to capture emerging markets.
- Innovation in Product Lines: The company invests heavily in research and design. New products drive revenue growth.
- Digital Transformation: Enhanced online platforms support direct-to-consumer sales.
- Sustainability Measures: Eco-friendly products and practices are increasingly important to consumers.
ROI and Investment Scenarios Explained
The ROI scenarios compare potential returns across various holding periods. A short-term trade may yield a modest profit. A one-year holding period takes advantage of seasonal trends and earnings releases. A long-term investment targets significant appreciation and dividend growth.
Short-Term Scenario
Traders who hold positions for one month may see a 2–3% gain. These trades focus on quick moves. Market volatility and earnings results drive these changes.
Medium-Term Scenario
A one-year horizon offers returns of 10–15%. This period allows for adjustment based on quarterly results and strategic initiatives. Investors benefit from stable revenue growth.
Long-Term Scenario
Holding the stock for five years offers returns as high as 35–40%. This long-term view aligns with Nike’s brand strength and market expansion strategies. Investors must consider global trends and sustained innovation.
A summary table reiterates these points:
| Investment Duration | Expected Price Range (USD) | ROI Estimate (%) |
|---|---|---|
| 1 Month | 76 – 78 | 2 – 3 |
| 1 Year | 84 – 87 | 10 – 15 |
| 5 Years | 103 – 107 | 35 – 40 |
The table simplifies decision-making by offering clear expectations.
Detailed Monthly Forecast Analysis
Breaking down the forecast by month reveals nuances. Each month brings its own set of market conditions:
- March 2025: The earnings report acts as a catalyst. Expect short-term volatility with a rebound after the report.
- April 2025: Post-report stability drives a mild upward trend.
- May 2025: Seasonal product launches and consumer behavior support higher prices.
- November 2025: The holiday season boosts demand. Sales promotions may contribute to a temporary price increase.
Comparative Analysis and Historical Trends
A review of historical performance provides context. Nike’s stock history shows that temporary setbacks have led to strong recoveries. The data shows that market corrections are followed by periods of growth.
For example:
- In 2021, the stock recovered strongly after dips in previous years.
- In 2022, a significant correction set the stage for future gains.
- The current year (2025) shows a measured decline followed by stabilization.
Analyst Ratings and Market Consensus
Analyst opinions are an essential element of market sentiment. A majority of analysts have rated Nike as “Buy.” Their forecasts rely on both qualitative and quantitative analyses. The average target price of USD 92.30 reflects positive long-term sentiment.
The rating breakdown indicates:
- A solid consensus with no “Sell” ratings.
- Confidence in Nike’s ability to manage market challenges.
- Alignment between technical analysis and fundamental growth prospects.
Actionable Advice for Investors
Investors looking at Nike stock should:
- Monitor quarterly earnings closely.
- Use technical analysis for entry and exit points.
- Stay updated with global market trends.
- Review analyst reports regularly.
- Diversify holdings to manage risk.
This report is based on current market data as of March 10, 2025. Investors are encouraged to review the latest filings and trusted financial news for any updates or changes in market conditions.
4 thoughts on “Nike Stock Price Forecast, Price Prediction and Technical Analysis (2025-2030)”